
- The EUR/USD weekly forecast shows a rebound in the dollar.
- The greenback fell in anticipation of a rate cut by the Fed.
- Powell noted that employment risks had increased.
The EUR/USD weekly forecast shows weakness as the US dollar recovers ground after the Fed’s rate cut, as the impact has already been priced.
Ups and downs of EUR/USD
The EUR/USD pair had a bullish week but closed well below its highs as the dollar ended the week strong. At the start of the week, the greenback fell in anticipation of a rate cut by the Fed. As a result, EUR/USD gained. However, the trend soon shifted after the Fed meeting.
–Are you interested in learning more about MT5 brokers? Check our detailed guide-
Policymakers voted to lower borrowing costs as expected. Moreover, they noted that employment risks had increased. However, the central bank will also keep monitoring inflation risks. Since there were few surprises, the dollar recovered from its lows, sending EUR/USD lower.
Next week’s key events for EUR/USD
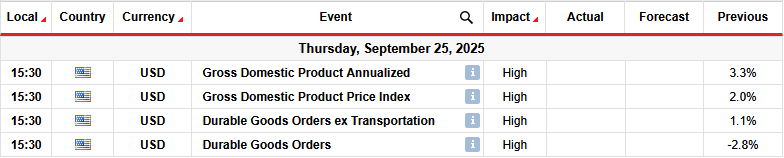
Next week, the US will release its GDP and durable goods orders reports. These figures will indicate how the economy and growth are performing and will continue to influence the outlook for Fed rate cuts.
So far, it is only the labor market that has shown significant weakness. Softness in other sectors of the economy would increase pressure on the Fed to lower borrowing costs. On the other hand, upbeat reports would ease worries about the state of the economy.
EUR/USD weekly technical forecast: Weaker bullish momentum, RSI divergence
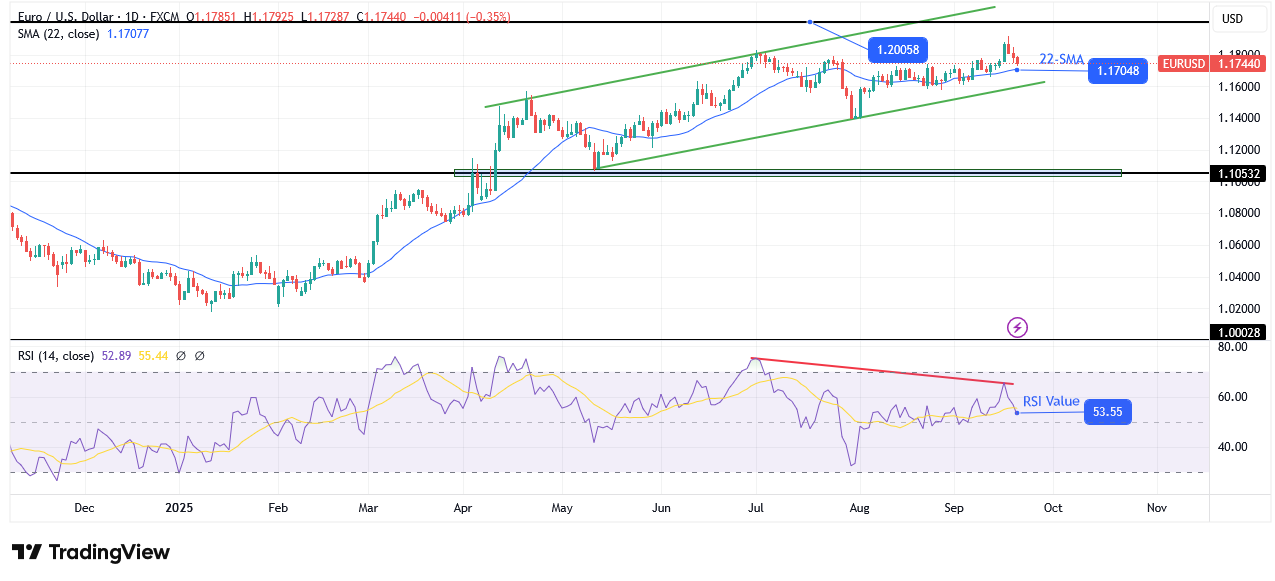
On the technical side, the EUR/USD price is pulling back to retest the 22-SMA support line after making a new high. However, since it is still above the SMA and the RSI is over 50, the bullish bias is strong. At the same time, the price trades in a bullish channel with clear support and resistance lines.
–Are you interested in learning more about forex signals telegram groups? Check our detailed guide-
A break below the SMA would allow the price to retest the channel support before either breaking below or bouncing higher. On the other hand, if the SMA holds firm the price will bounce higher, likely breaking above the 1.2005 key resistance.
Meanwhile, although the bias is bullish and the price has made a higher high and low, the RSI has made lower ones. Therefore, there is a bearish divergence, a sign that bullish momentum is fading. This could give bears an upper hand if bulls do not regain momentum.
Looking to trade forex now? Invest at eToro!
68% of retail investor accounts lose money when trading CFDs with this provider. You should consider whether you can afford to take the high risk of losing your money.