
- The AUD/USD weekly forecast shows a range-bound momentum as the data from both sides counterbalanced the price action.
- RBA’s unchanged rate decision could not impress buyers, while sellers shied amid a weaker greenback.
- Traders look ahead to the US and AUS inflation figures to find a directional bias.
The AUD/USD weekly forecast shows the pair holding steady amid mixed Australian and US economic signals, keeping markets cautious ahead of key inflation releases. After a softer economic indicator weakened the greenback, hopes of near-term monetary easing emerged again.
–Are you interested in learning more about XRP price prediction? Check our detailed guide-
Meanwhile, the UoM Consumer Sentiment revealed the index falling to 50.3 from 53.6 in October, signaling growing concerns about fiscal uncertainty. The report suggested one-year inflation expectations climbing to 4.7%, with the five-year expectations easing to 3.6%. While the Challenger job cuts came over 153,000 private sector layoffs.
In Australia, the Reserve Bank of Australia kept the cash rates unchanged at 3.6% in November. Meanwhile, Governor Michele Bullock stated that the board did not discuss policy easing amid persistent inflation pressure. The Australian CPI climbed by 1.3% QoQ from 0.7%, suggesting the odds of a prolonged restrictive policy. However, the weaker Chinese trade surplus and declining exports limit Aussie upside.
AUD/USD Key Events Next Week
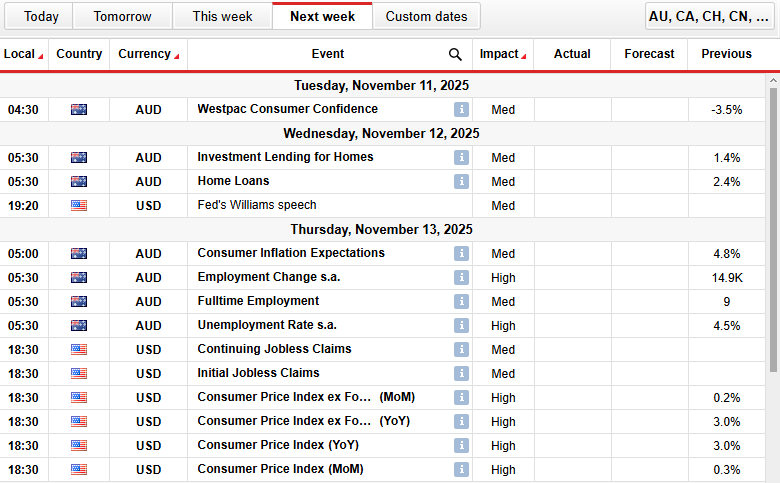
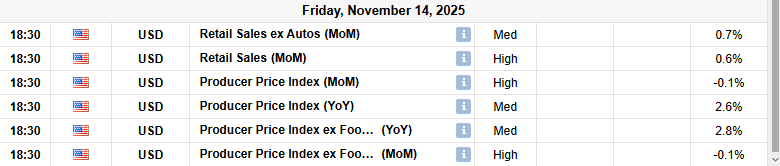
The major events in the coming week include:
- US Consumer Price Index ex Food and Energy (MoM)
- US Consumer Price Index ex Food and Energy (YoY)
- US Consumer Price Index (YoY)
- US Consumer Price Index (MoM)
- US Retail Sales (MoM)
- US Producer Price Index (MoM)
- AUD Employment Rate s.a.
- AUD Employment Change s.a.
- AUD Consumer Inflation Expectations
In the coming week, traders anticipate the CPI data from both sides as a key market driver, as central bank actions are primarily linked with inflation.
AUD/USD Weekly Technical Forecast: Sandwiched by 50- and 200-DMA
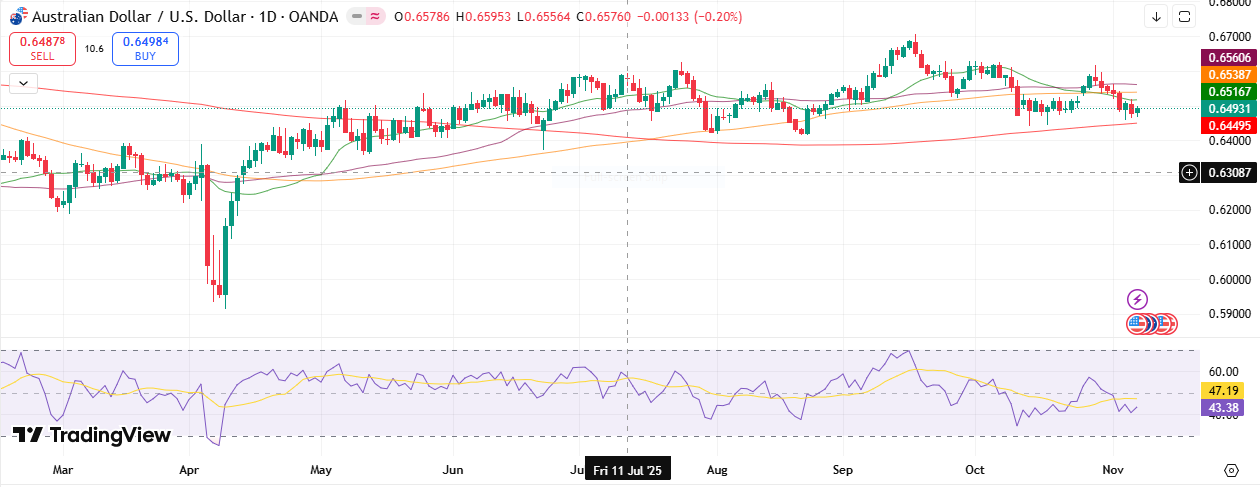
The AUD/USD daily chart reveals the pair under moderate selling pressure as it trades near 0.6500 after repeated attempts to stay above the short-term resistance levels. The price stays below the 20- and 50-day MA, reflecting sellers in control. While the pair consolidates above the 200-day MA.
–Are you interested to learn more about low spread forex brokers? Check our detailed guide-
The RSI is near 43, indicating subdued momentum. A break above 0.6560 could extend gains towards 0.6615 and 0.6650. Conversely, a drop below 0.6450 could trigger further downside towards 0.6400 and 0.6300.
Support Levels
Resistance Levels
Looking to trade forex now? Invest at eToro!
68% of retail investor accounts lose money when trading CFDs with this provider. You should consider whether you can afford to take the high risk of losing your money.