- The weakening labor market and growing expectations of rate cuts weigh on the AUD.
- The persistent geopolitical instability, like US-China trade frictions, supports the US dollar.
- Traders look forward to the Philly Fed Manufacturing Index and FOMC’s Waller comments for further policy direction.
The AUD/USD outlook suggests the USD weighs on the AUD amid weaker domestic data, strengthening expectations of monetary easing by the Reserve Bank of Australia.
–Are you interested in learning more about forex conventions? Check our detailed guide-
Australia’s recent labor report indicated a 14.9K rise in employment in September, below expectations of 17k. Meanwhile, it showed a 4.5% rise in the highest unemployment rate since 2021. This indicated a weakening labor market, signaling traders to increase bets on a November rate cut. The markets price in a 25 basis point cut, with expectations climbing to 70% from an earlier 40%.
RBA Assistant Governor Christopher Kent emphasized that financial conditions and the cash rate have improved after previous rate cuts, with room for further policy flexibility. Meanwhile, Assistant Governor Sarah Hunter affirmed that inflation could stay elevated in Q3 beyond expectations amid the ongoing uncertainty of global demand.
From the US, expectations of Fed easing and geopolitical conditions define the dollar’s tone. The Fed’s Powell implied that there is a probability of another rate cut later this month, softening the Dollar Index (DXY). The weak hiring and government shutdown risks persist. Moreover, US-China trade tensions affect AUD’s recovery due to the close trade ties between the two.
AUD/USD Daily Key Events
The significant events on the day include:
- Philly Fed Manufacturing Index
- FOMC Member Waller speaks
Traders are looking ahead to the Philly Fed Manufacturing Index and FOMC’s Waller speech for further insights into policy cues.
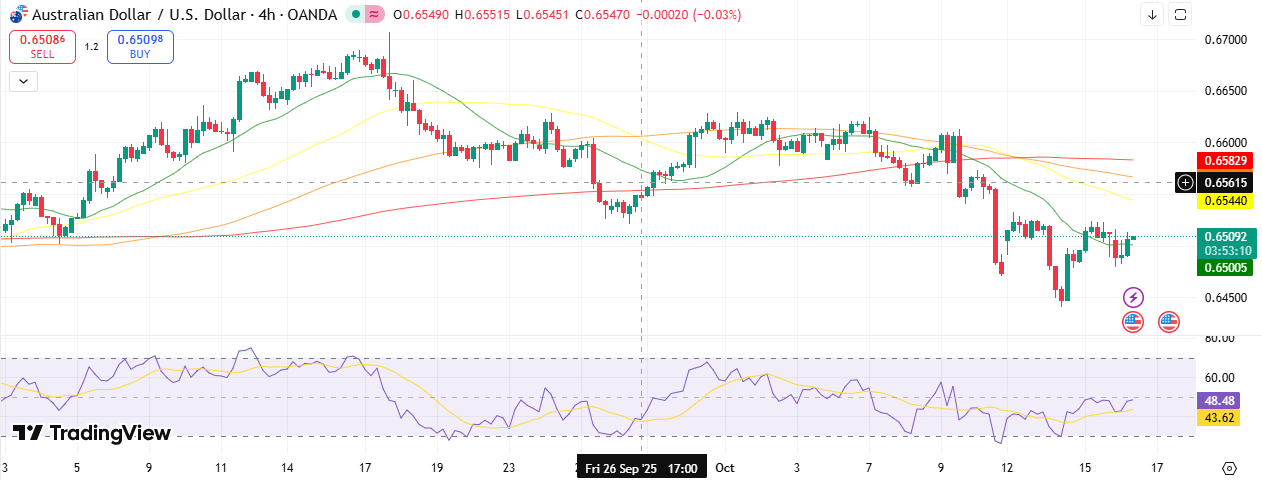
AUD/USD Technical Outlook: Stays Pressured around 0.6500

The AUD/USD 4-hour chart signals the pair stays near 0.6500 after a struggle to hold above the near-term resistance around 0.6540, signaling a restricted bullish bias. The pair remains below the 50-, 100-, and 200-period MAs. The 50-MA at 0.6540 serves as a key resistance zone, followed by the 100-MA around 0.6560 and the 200-MA near 0.6580. The initial support lies at the 0.6450 level and 0.6400.
–Are you interested in learning more about Ethereum price prediction? Check our detailed guide-
The RSI is at 48, signaling a neutral bias. Additionally, chances for a trend reversal seem low. A decisive break above 0.6540 could extend gains towards the 0.6620 level. However, selling pressures dominate below this level.
Looking to trade forex now? Invest at eToro!
68% of retail investor accounts lose money when trading CFDs with this provider. You should consider whether you can afford to take the high risk of losing your money.
