
- The gold forecast reveals a neutral to bearish bias, as the dollar holds firm following the release of the FOMC minutes.
- A modest increase in risk appetite caps the market.
- Market participants await the long-overdue US NP data as a key signal to the Fed.
Gold forecast remains subdued in Thursday’s European session after failing to sustain above the $4,100 mark. The markets are now bracing for the September US NFP data due later today.
-Are you looking for automated trading? Check our detailed guide-
Earlier in the day, gold reached $4,097 but soon found selling traction, leading to the weekly lows under $4,050.
On the other hand, the US dollar climbed to its highest level since May, supported by reduced expectations of a December Fed rate cut following the release of the October 28-29 meeting minutes. The FOMC meeting revealed a divided decision among policymakers, with some favoring a lower target range for the Fed cut and others opposed to it. Policymakers cautioned that further easing could risk entrenched inflation.
This greenback’s strength weighed on the yellow metal, prompting a retracement from the $4,120 zone. However, the upbeat tech sector earnings increased the risk appetite, capping the greenback’s further upside—meanwhile, the geopolitical situation, such as the Russia-Ukraine peace framework, limited gold’s bullish trend.
Gold Daily Key Events
The significant events in the day include:
- Average Hourly Earnings m/m
- Non-farm Unemployment Change
- Unemployment Rate
- Philly Fed Manufacturing Index
- Unemployment Claims
- Existing Home Sales
The US NFP report is expected to reveal a rise of 50,000 jobs, with a steady employment rate at 4.3% and wage growth at 3.7%. A softer data release could reignite bets on a Fed cut and boost gold, while stronger data could strengthen the dollar and weaken the metal.
Gold Technical Forecast: Oscillating Around MA Cluster
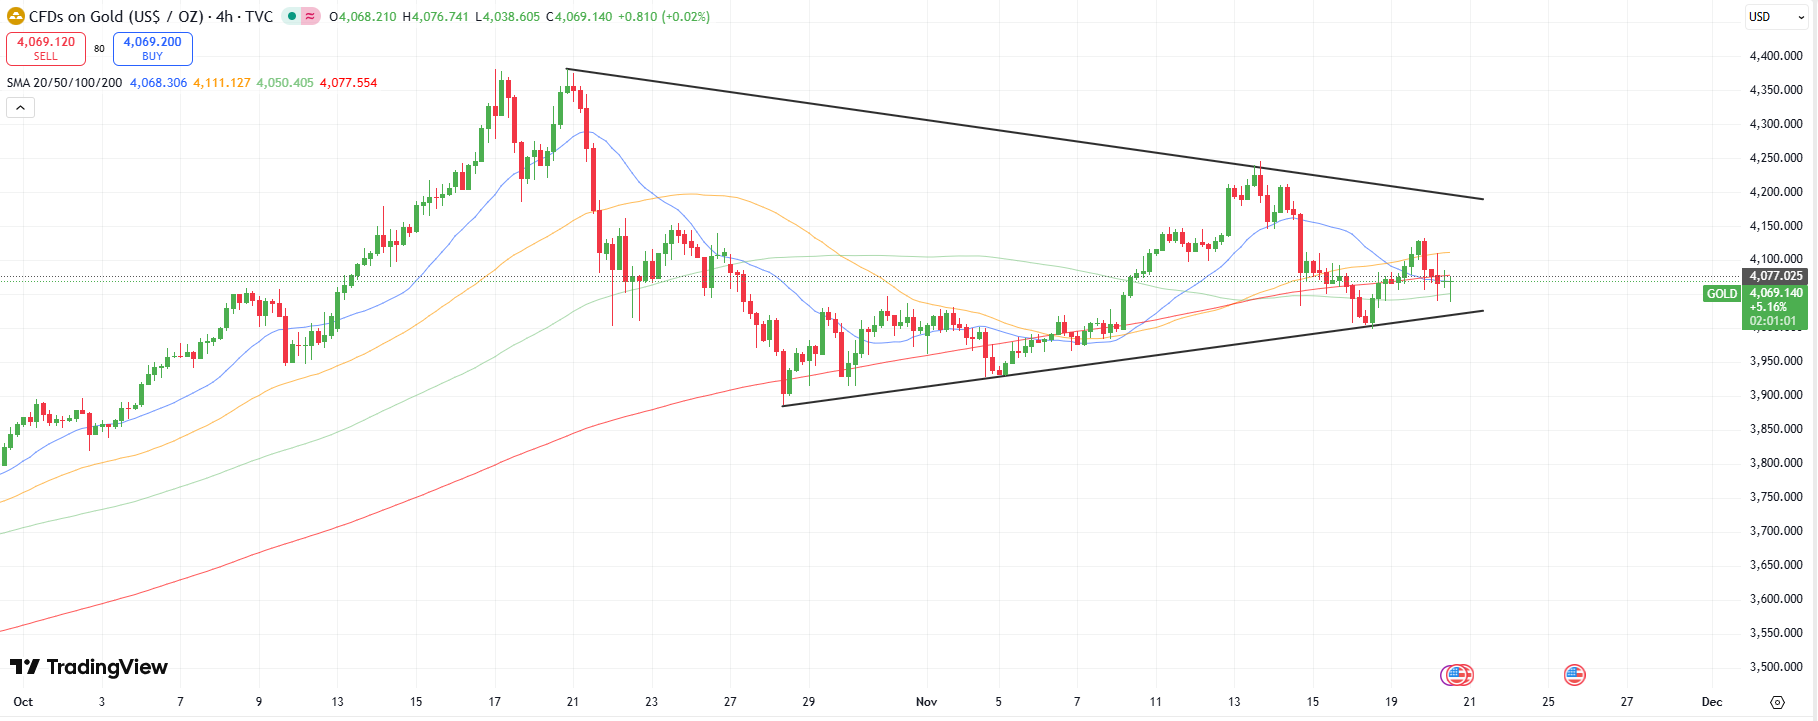
Gold’s 4-hour chart shows a tight consolidation, as it trades near $4,044 after repeated failed attempts to climb above $4,100. The price remains near the key 50-period MA, around $4,050, forming an immediate dynamic resistance zone. Meanwhile, the key 200-period MA near $4,112 acts as a support zone.
-If you are interested in forex day trading, then have a read of our guide to getting started-
The RSI at mid-40s signals weakening bullish bias. A close above the $4,112 level could extend the upside further. In contrast, a break below $4,050 could trigger a downside towards $4,000 and $3,900.
Support Levels
Resistance Levels
Looking to trade forex now? Invest at eToro!
67% of retail investor accounts lose money when trading CFDs with this provider. You should consider whether you can afford to take the high risk of losing your money.