
- The gold outlook exhibits an upside bias amid a weak US economic situation, which has bolstered gold’s safe-haven appeal.
- Declined Fed cut bets, US economic concerns, and potential slow GDP growth limit the downside of the yellow metal.
- Traders look forward to FOMC Schmid’s speech for further policy direction.
The gold outlook exhibits bullish momentum, trading near $4,170 on Friday, amid a weakening US dollar. Earlier today, gold rose above the $4,200 mark before dropping to its daily lows. This pullback was driven by a drop in expectations for a December Fed cut, with markets pricing in a 50% probability of the cut.
–Are you interested in learning more about XRP price prediction? Check our detailed guide-
Several comments from Fed policymakers have cautioned investors to trim their bets for the December rate cut. However, investors are convinced that the weak economic momentum could allow further Fed easing.
Minneapolis Fed President Neel Kashkari noted a mixed economic outlook, as inflation continues to rise. The sticky inflation and fresh economic concerns in the US limit gold’s downside, while economic uncertainty weighs on the US dollar.
Meanwhile, the reopening of the federal government brought a wave of concerns over the country’s struggling fiscal outlook. Markets anticipate the release of delayed economic data, expecting weak labor market conditions and slow GDP growth.
Some estimates have predicted a potential 1.5% to 2% drop in quarterly growth amid weak labor market data. These softer economic conditions further boost gold’s safe-haven appeal.
Gold Daily Key Events
The significant events in the day include:
- FOMC Member Schmid Speaks
On Friday, traders look ahead to commentary from FOMC member Schmid to find cues about the Fed’s policy path in the absence of data.
Gold Technical Outlook: Lacking Direction Near 20-MA
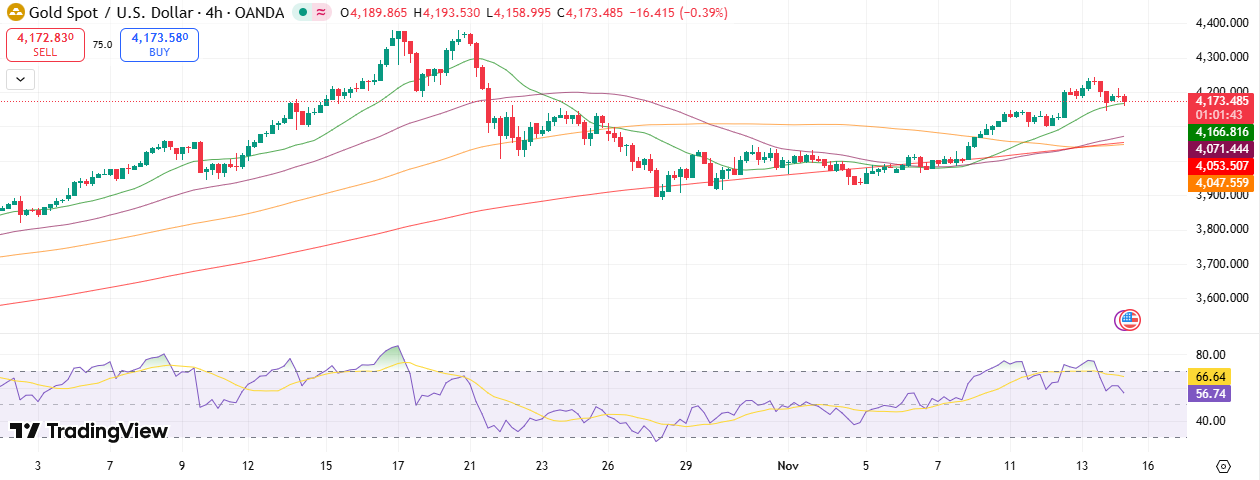
Gold’s 4-hour chart shows a slowing bullish momentum, as it trades near $4,170 after its strong rally above $4,200. Price remains above the 50-, 100-, and 200-period MAs, suggesting a broader bullish bias despite its intraday lows. However, the price wobbling near the 20-MA suggests a near-term consolidation.
–Are you interested to learn more about low spread forex brokers? Check our detailed guide-
The RSI falling to 60 indicates a decline in bullish strength. However, a trend reversal is not confirmed yet. If bulls sustain above $4,200, a new upside wave could emerge. Conversely, a break below $4,166 could trigger a deep correction to $4,100.
Support Levels
Resistance Levels
Looking to trade forex now? Invest at eToro!
68% of retail investor accounts lose money when trading CFDs with this provider. You should consider whether you can afford to take the high risk of losing your money.