
Our software is already established well beyond commodity market analysis. Stock indices, currencies, and even interest rates — all this data is already in the app.
Today, we’re expanding the data offering with sector indices. I was personally interested in this data, as I trade these indices through ETFs quite often.
You can browse the new data in the input field in the app under the new “Sector indices” group.
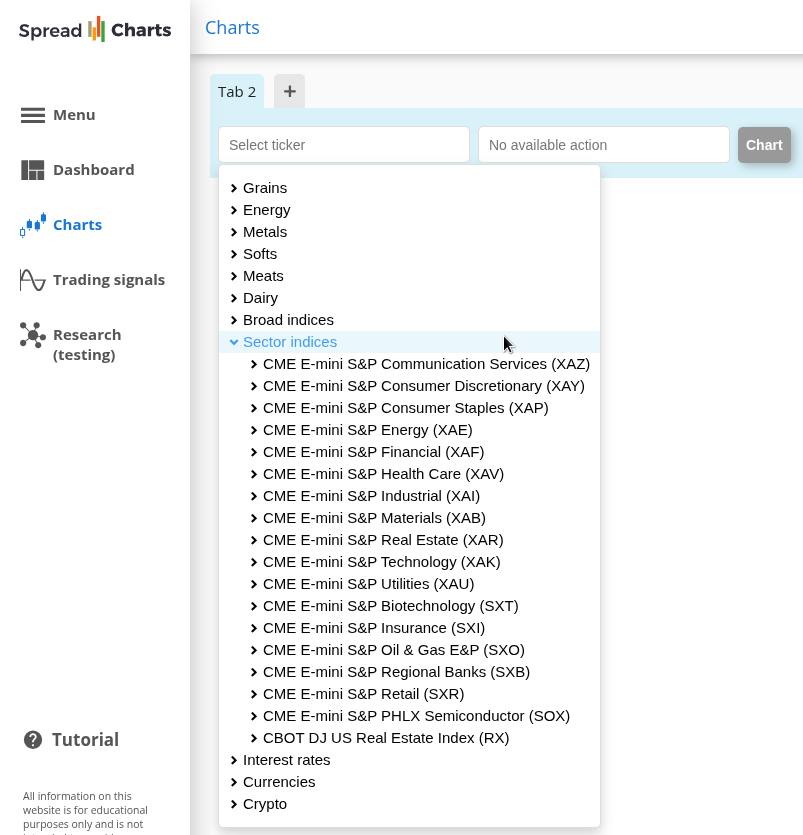
We’ve covered all the S&P sectors plus a few important industry sub-indices like Biotech, Semiconductors, or Oil & Gas. You can find all the contract specifications on this CME Group page.
Besides charting the indices on their own, this data can be incredibly useful in various ratios. For example, here’s the Consumer Discretionary / Staples ratio that serves as an important cyclically sensitive measure of the broad US economy. Its weakness often marked the start of major corrections — like this spring.

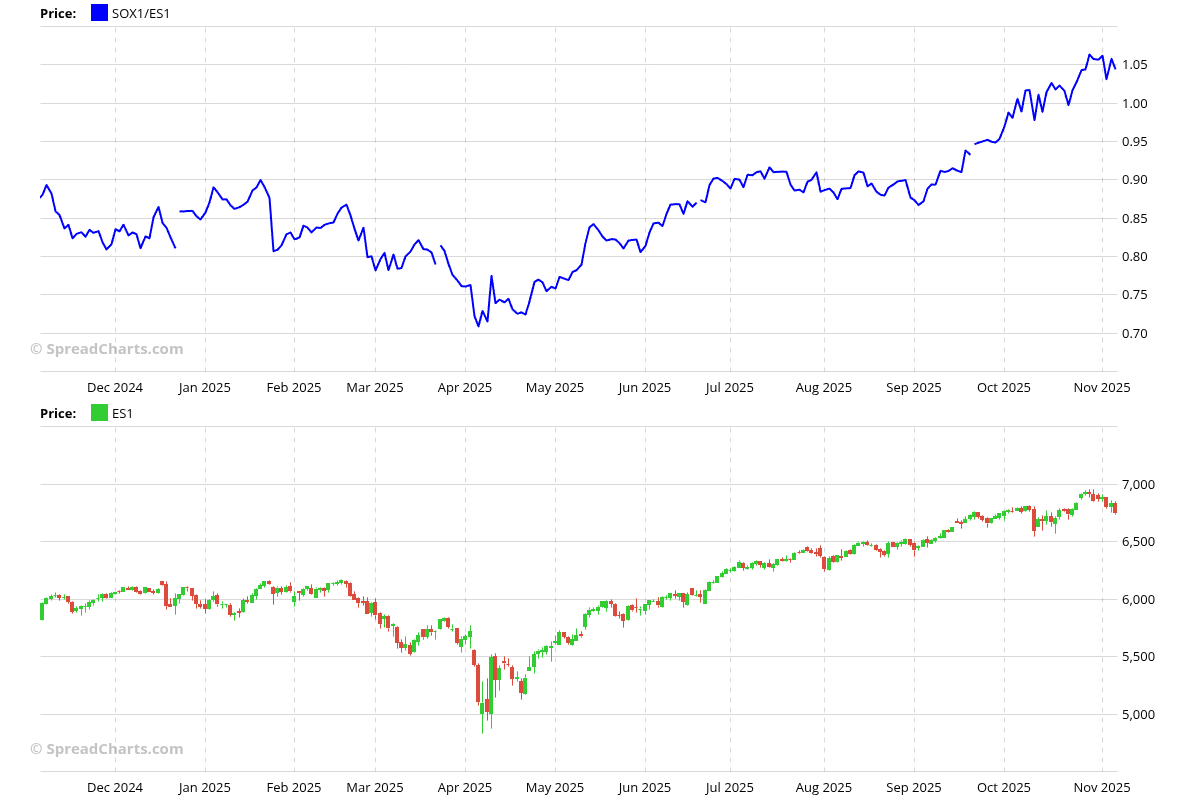
Or you can track the relative performance of the “modern oil” that powers the information economy and the current stock market bubble. Yes, I mean the Semiconductor industry. When this thing starts to wobble, you better be careful.
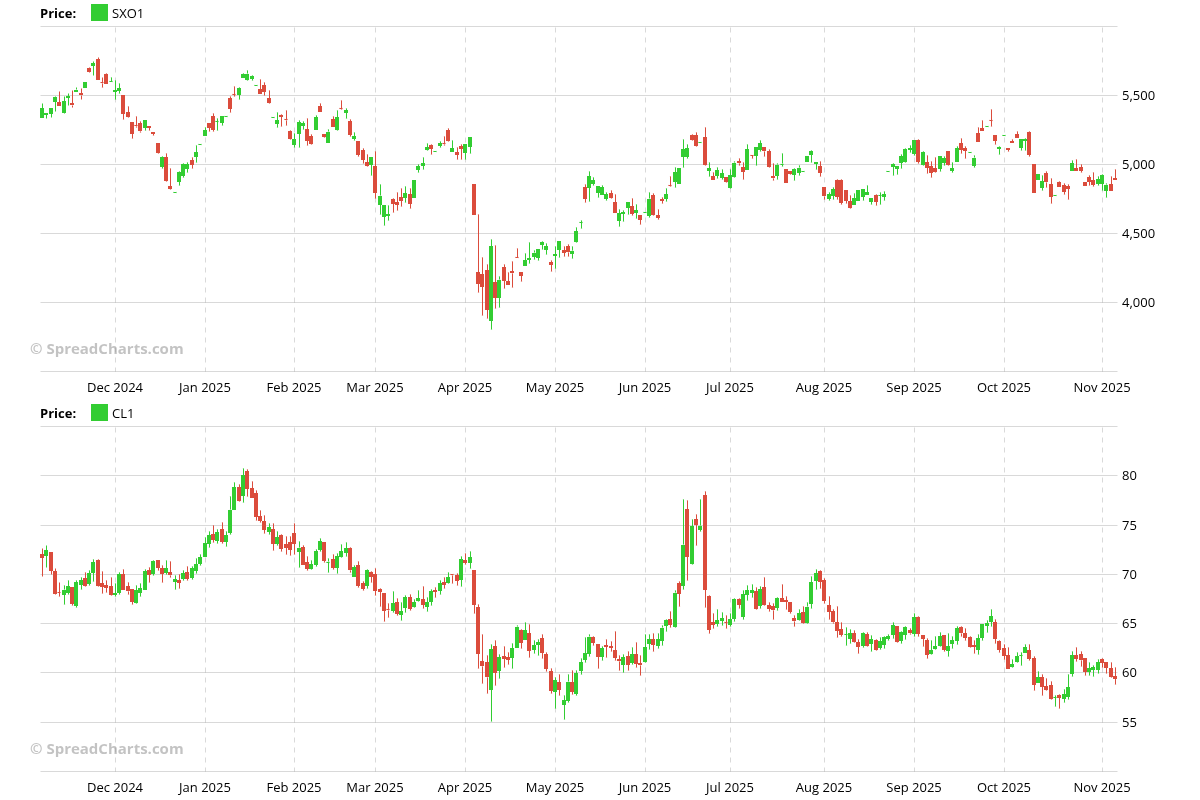
Or if we stay with the traditional oil, comparing it with the performance of the Oil & Gas industry could provide important insights.
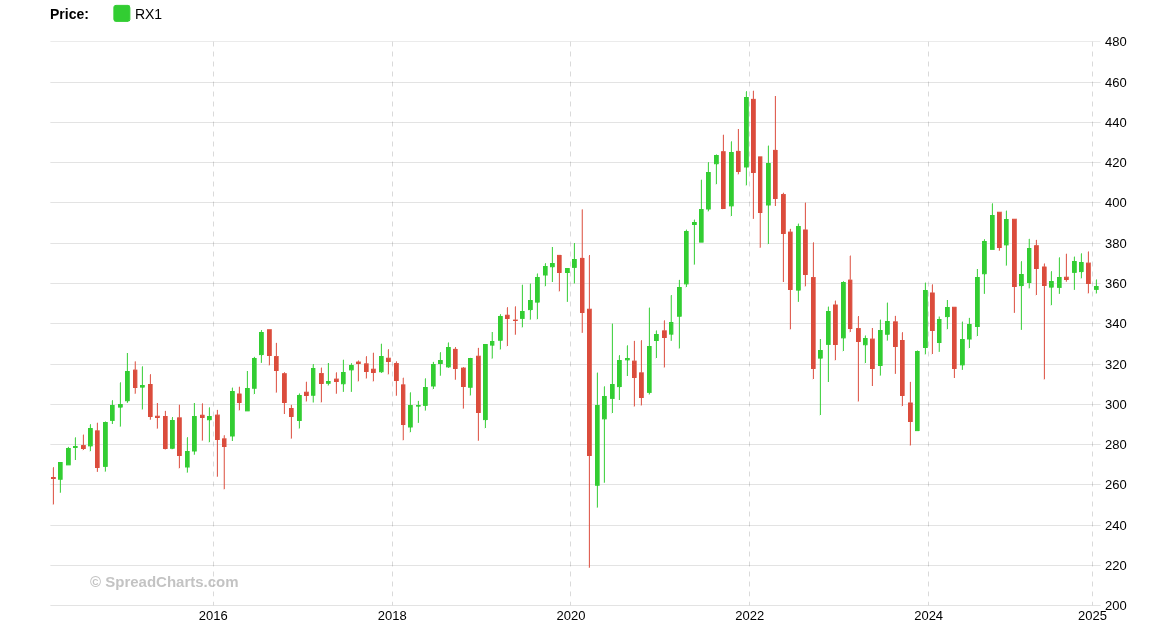
Even if you wish to follow the long-term performance of US real estate, it’s no problem with the Dow Jones Real Estate index.
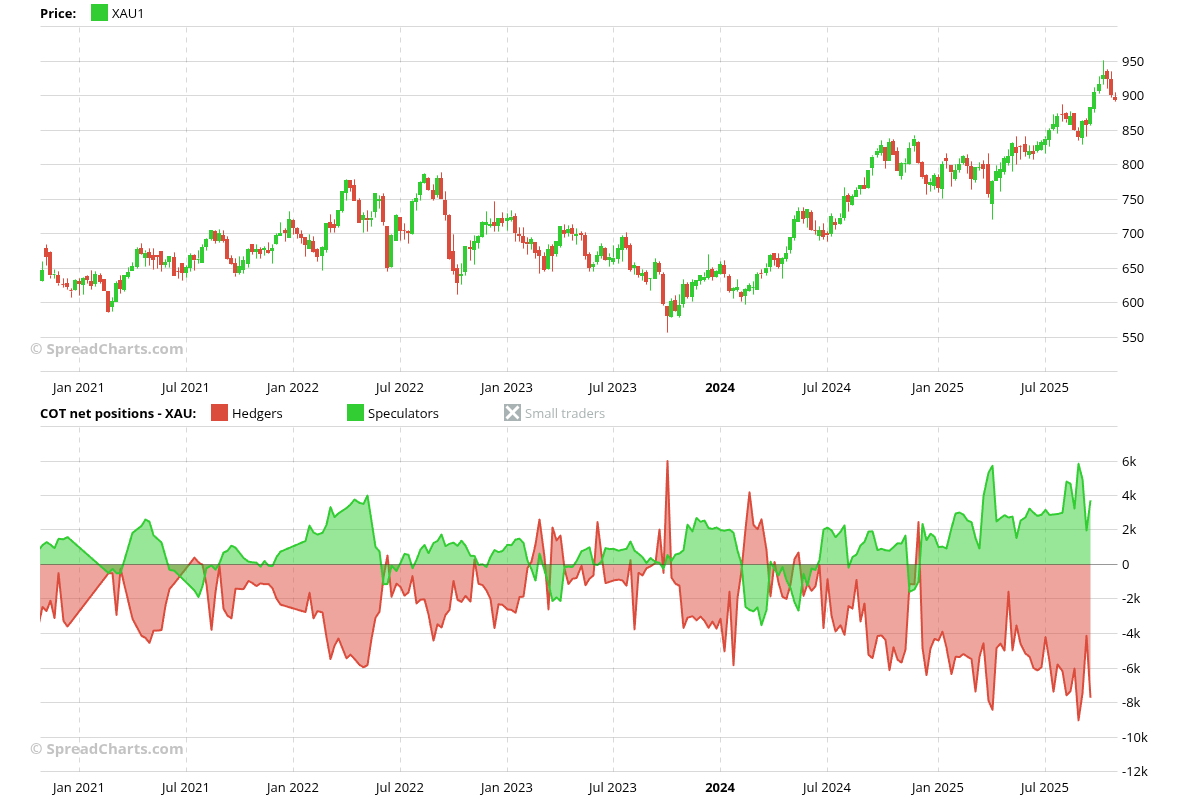
And we even have Commitments of Traders data for most of these futures. Just take the Utilities sector as an example.
I hope you’ll enjoy the new data as much as I do. I can promise you we’ll be adding more interesting datasets in the near future.