
- The AUD/USD outlook shows the pair recovering some losses after RBA’s Bullock left cautious comments.
- As widely anticipated, the RBA kept the cash rates unchanged at 3.6% on Tuesday.
- Traders await FOMC Bowman’s commentary for further policy direction.
The AUD/USD outlook remains weak, trading near 0.6520 after a brief recovery amid the Reserve Bank of Australia’s rate decision. The RBA kept the cash rates unchanged at 3.60%, suggesting that future policy decisions will be based on the upcoming data. The lower labor demand, contrasted with the stronger Australian CPI and a boost in building permits, acted as key catalysts for this development.
–Are you interested to learn more about low spread forex brokers? Check our detailed guide-
RBA Governor Michele Bullock affirmed that less easing may be required and noted that the meeting did not center on rate cuts at this stage. The annual core inflation stood above 3%, complicating the 2-3% target range achievement.
Additionally, the RBA expects sticky inflation, delaying expectations for price stability till mid-2026, and suggests a restrictive policy stance till then. The market sentiment remains cautious as Australian 3-year bond yields rose five bps and briefly recovered before extending its losing streak to a fifth consecutive session.
On the other hand, the US dollar held firm amid dampened expectations for a December rate cut and deteriorated risk sentiment. The Fed officials maintained a cautious stance and affirmed that consistent inflation progress is required before further easing, boosting the US yields and the dollar’s safe-haven appeal. The greenback will likely remain firm soon, unless the RBA takes a more assertive stance or the upcoming US data softens.
AUD/USD Daily Key Events
The significant events in the day include:
- FOMC member Bowman speaks
- RCM/TIPP Economic Optimism
On Tuesday, traders look ahead to the FOMC’s Bowman remarks for insights into the policy outlook.
AUD/USD Technical Outlook: Sellers in Control Below Key MAs
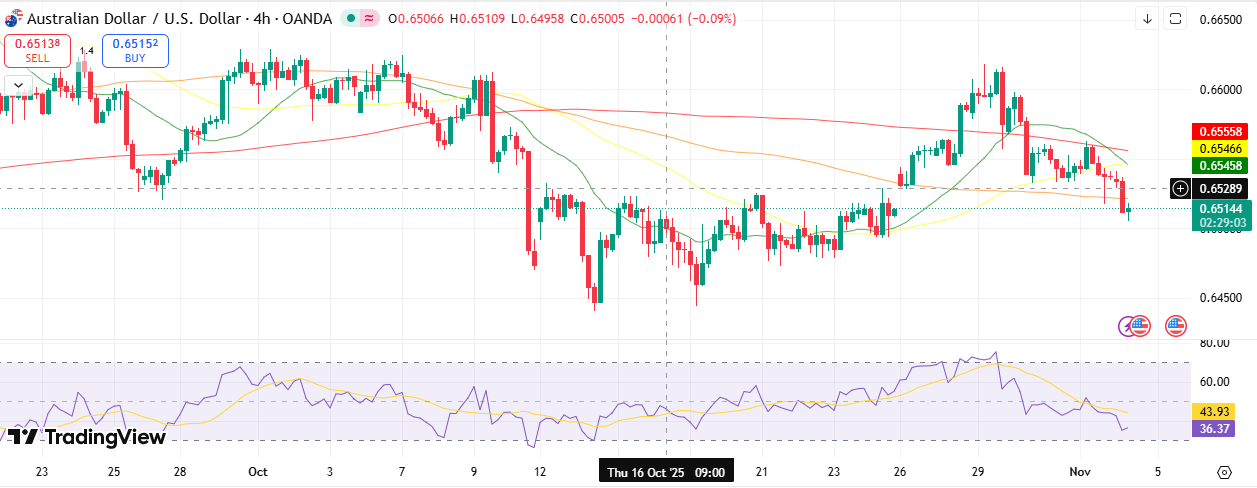
The AUD/USD 4-hour chart shows a downside bias, trading around 0.6500, after struggling to hold above the key moving averages. The price finally broke below the 50-period MA at 0.6525, while the 100- and 200-MA have formed a bearish crossover, signaling further downside.
–Are you interested to learn more about forex bonuses? Check our detailed guide-
The RSI stays below 40, indicating the pair is approaching the oversold territory. The sellers will dominate if the pair remains below the 200-MA near 0.6550. A decisive breach above 0.6550 could open room for further upside towards 0.6600. Conversely, a drop below 0.6500 could extend the downside towards 0.6480 and 0.6450.
Support Levels
Resistance Levels
Looking to trade forex now? Invest at eToro!
68% of retail investor accounts lose money when trading CFDs with this provider. You should consider whether you can afford to take the high risk of losing your money.