
- GBP/USD forecast remains supported by sticky UK inflation and steady BoE stance.
- Dollar’s advance stalls as US data blackout clouds rate outlook.
- Markets see October Fed cut as certain, while December cut remains uncertain.
The GBP/USD forecast stays firm this week as the US dollar faces receding momentum amid a delay in key economic releases caused by the continued US government shutdown. The greenback lost steam as its repricing trade heavily depends on the solid US data, especially the NFP. It leaves traders cautious about further upside in the dollar as normal data flow resumes.
–Are you interested to learn more about automated forex trading? Check our detailed guide-
Markets now price in around 50 bps rate by the Federal Reserve until the end of 2025 and around 100 bps cut by 2026. Some economists view this as overly dovish, leaving little room for repricing in the absence of data. The data blackout, including NFP and CPI releases, has sealed the expectations for an October rate cut, though traders remain divided on the December cut. The next three NFP and CPI prints could further determine the Fed’s path into year-end.
On the UK front, fundamentals remain unchanged as the Bank of England chose to maintain the policy rates in the last meeting and signaled a cautious approach in balance sheet reduction. Though the policymakers refrained from any hawkish shift, they showed concerns about persistent inflationary pressure. UK inflation remains stubbornly high as the core CPI and wage growth stay elevated while consumer inflation expectations are ticking higher. Hence, the markets are pricing in only 6 bps of easing this year with 37 bps in 2026, highlighting the relatively higher for longer rates compared to the peers.
GBP/USD Key Events Today
Fed speeches due today hold importance as markets are looking for cues about the policy path. Meanwhile, tomorrow’s FOMC meeting minutes are viewed as a significant event for the GBP/USD. From the UK, the calendar remains thin this week.
GBP/USD Technical Forecast: Bearish Below 1.3500
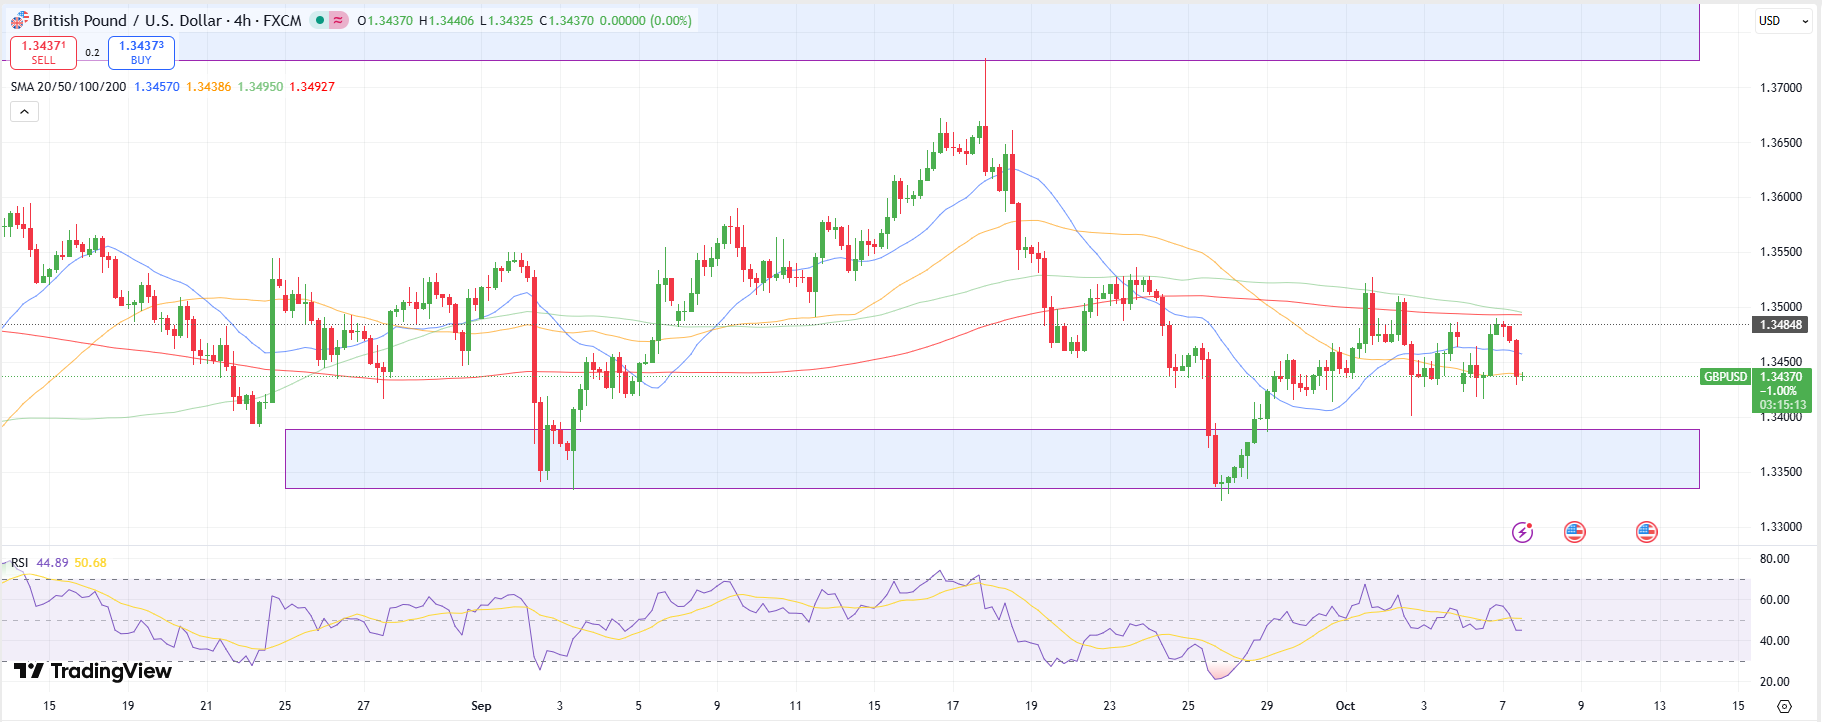
The GBP/USD 4-hour chart shows a mildly bearish picture as the price moves back below 1.3450 and the key MAs. The price is slowly grinding lower to test the demand zone near 1.3350. An RSI under 50.0 also shows signs of weakness and room for more losses. However, the bears are facing a hurdle at the 50-period MA.
–Are you interested to learn more about forex signals? Check our detailed guide-
On the flip side, if prices close above the 20-period MA, the recovery attempt could intensify and test the 200-period MA near 1.3485. However, the buying momentum could see tough resistance at 1.3500 (100- and 200-MA confluence zone) ahead of 1.3535 (swing high).
Looking to trade forex now? Invest at eToro!
67% of retail investor accounts lose money when trading CFDs with this provider. You should consider whether you can afford to take the high risk of losing your money.