
- The USD/CAD weekly forecast exhibits a bullish trend, with the U.S. dollar maintaining a slight advantage over the Canadian dollar.
- The price level is testing the resistance level at 1.3969. In the event of a breach, it could rise to 1.400.
- Higher U.S. Treasury yield, elevated inflation, and oil prices balance each other, keeping the pair in a confined range.
The USD/CAD weekly forecast suggests that the price is moving back towards the three-month highs, suggesting a bullish trend. The pair holds between 1.3890 and 1.3980, indicating robust buying demand. The upside move stems from the waning Canadian dollar instead of a stronger U.S. dollar.
–Are you interested to learn more about automated forex trading? Check our detailed guide-
Moving ahead, the U.S. dollar may stay elevated despite the Federal Reserve maintaining its current rate cut outlook. Rising inflation and labor market instabilities could keep U.S. Treasury yields high.
On the other hand, Canadian economic dependence on oil exports and global growth challenges could keep the CAD on its back foot. Even though the Canadian dollar recovered by the end of the week, it still saw a 0.1% weekly decline.
This marks its second weekly loss, hitting its lowest level since May earlier this week. Analysts credit the Loonie’s weak performance to the declining crude oil prices and a downturn in the Canadian trade. Although oil rose 1% to $61.06 per barrel, it braced for a weekly dip amid the news that OPEC+ nations could increase production.
In light of these events, USD/CAD stays a strong candidate for USD-strength trades as we enter the fourth quarter, with the probability of challenging the 1.4000 level.
USD/CAD Key Events Next Week
Some of the major events happening next week include:
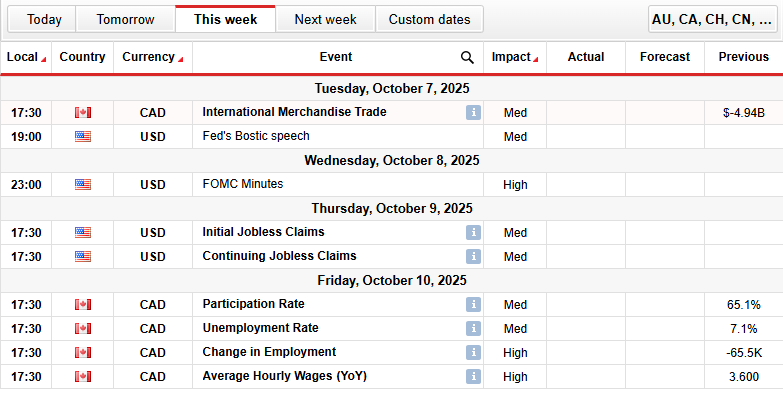
- Fed’s Bostic Speech (Tuesday).
- International Merchandise Trade (Tuesday).
- FOMC minutes (Wednesday).
- Initial Jobless Claims (Thursday).
- Change in Employment (Friday).
- Average Hourly Wages (Friday).
- Unemployment Rate (Friday).
- Participation Rate (Friday).
USD/CAD Weekly Technical Forecast: Make or Break at 1.4000
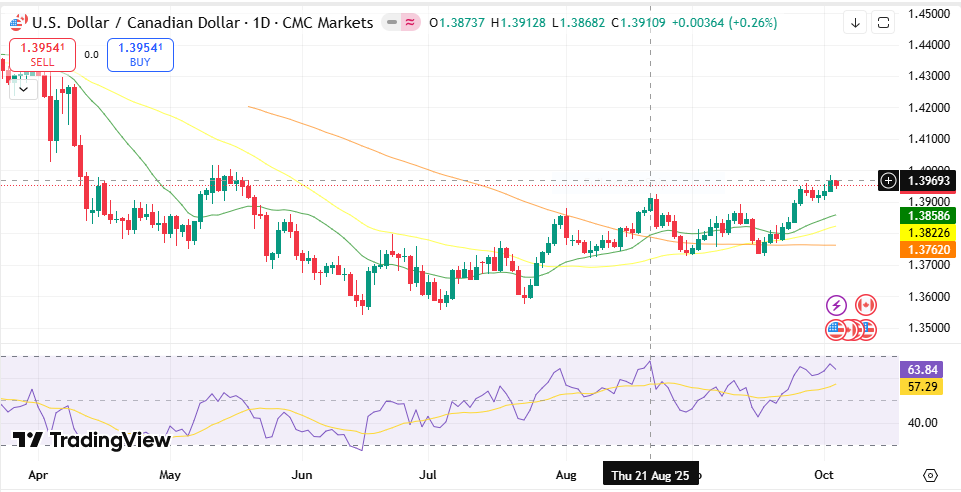
Technically, in the USD/CAD pair, the price is challenging a resistance level near 1.3969, staying closer to the highs from late August. The price is consistently rising above the 50-day (green), 100-day (yellow), and 200-day moving averages. The upward slope of all these MAs reveals the strength of the bullish trend.
–Are you interested to learn more about forex signals? Check our detailed guide-
The RSI at 63.84 indicates that the market could rise before reaching the overbought level at 70. However, the current price is trading near the resistance level of 1.3970. If the prices surge above 1.3970, it can target the next resistance level at 1.4000. However, if it fails to break out of this level, it may lead to a pullback towards 1.3827 or even lower.
Looking to trade forex now? Invest at eToro!
67% of retail investor accounts lose money when trading CFDs with this provider. You should consider whether you can afford to take the high risk of losing your money.