- The AUD/USD outlook points to further weakness in Australia’s labor market.
- Australia’s economy lost 5,400 jobs compared to the forecast of an addition of 21,200.
- The dollar gained after the Fed cut rates as expected on Wednesday.
The AUD/USD outlook points to further weakness in Australia’s labor market that could increase pressure on the RBA to lower borrowing costs. However, traders still expect the central bank to hold this month. Meanwhile, the dollar gained after the Fed cut rates as expected.
–Are you interested in learning more about ETF brokers? Check our detailed guide-
Data on Thursday revealed that Australia’s economy lost 5,400 jobs compared to the forecast of an addition of 21,200. The downbeat data highlighted weakness in the labor market. However, it was not enough to significantly shift the outlook for rate cuts. Traders are still expecting the RBA to hold rates this month. As a result, the Australian dollar recovered after an initial fall.
“Employment growth is running out of steam, with headcount little changed from four months ago,” said Sean Langcake, head of Macroeconomic Forecasting for Oxford Economics Australia.
“We don’t think these data are bad enough to spur the RBA into action this month. But another cut in November is expected.”
Meanwhile, the dollar gained after the Fed cut rates as expected on Wednesday. Nevertheless, the outlook remains dim for the currency as the central bank intends to continue easing borrowing costs this year.
AUD/USD key events today
AUD/USD technical outlook: Bears and bulls battle around 30-SMA

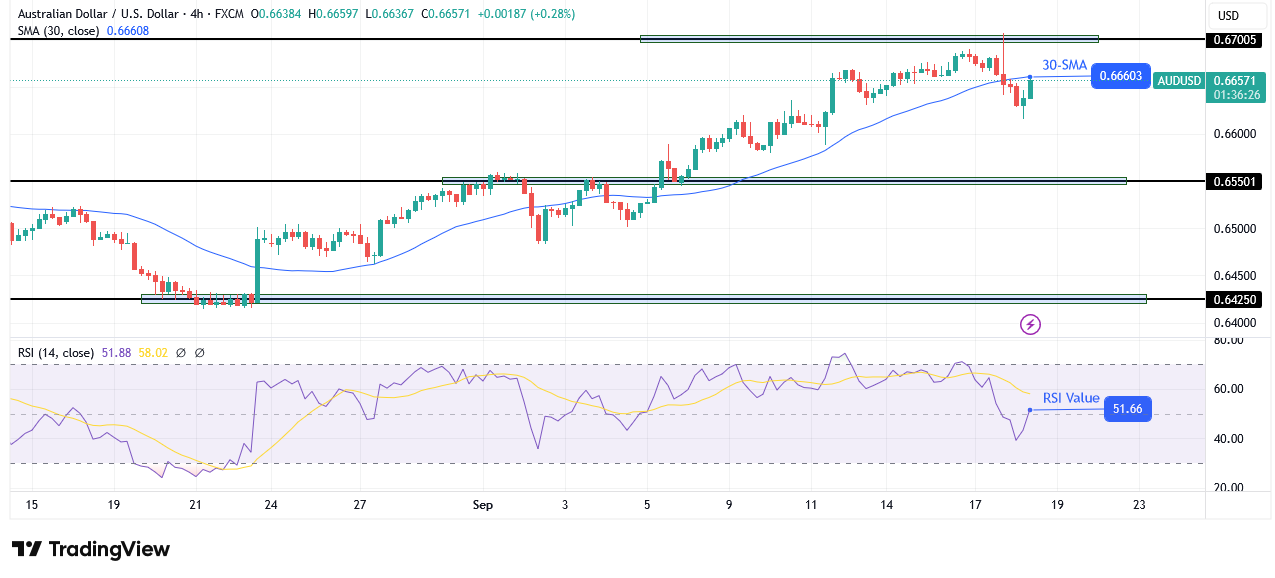
On the technical side, the AUD/USD price has recovered to retest the 30-SMA after a recent break below the line. The break had indicated a momentary shift in sentiment to bearish. However, to maintain the new bias, the price must remain below the SMA and the RSI under 50.
–Are you interested in learning more about Canada forex brokers? Check our detailed guide-
Before the sentiment shift, AUD/USD was trading in a steep bullish trend, keeping above the 30-SMA. At the same time, it was making higher highs and lows until it got to the 0.6700 key resistance level. Here, the price formed a large top wick on a bearish candle, showing a rejection of higher prices. As a result, the price broke below the SMA.
If the SMA holds as resistance, bears will get a chance to target the 0.6550 support level. At the same time, the price might start making lower highs and lows. On the other hand, if bulls break back above the SMA, the price will likely challenge the 0.6700 resistance for a new high.
Looking to trade forex now? Invest at eToro!
68% of retail investor accounts lose money when trading CFDs with this provider. You should consider whether you can afford to take the high risk of losing your money.
